24個商業情境》簡報裡的變化
上台做簡報,描述數據的趨勢、線形的走勢時,很多人只會一直說up、down,聽在老外的耳裡,就像是小學生在看圖說話,專業度不足,甚至顯得幼稚。
這跟台灣人的英文學習經驗有很大的關係。我們的表達型式當中,有很多I like、I feel、I am satisfied with、I am interested in 的句型,但我們在學英文的過程裡,國中、高中、大學甚或考試,都很少要求我們說明一個統計數據、分析一個chart(圖或圖表)。等到進到職場之後,每場簡報幾乎都必須描述數據、圖形的變化,站上台準備開口,才猛然發現,哎呀,只會說up 和down!
改善數據增減、圖形變化描述力不足的問題,先從加一點形容詞或副詞著手。
銷售量成長→銷售量平穩成長
There was a steady rise in sales.
Sales rose steadily.
銷售量下滑→銷售量明顯下滑
There was a significant fall in sales.
Sales fell significantly.
銷售量回升→銷售量小幅回升
There was a slight recovery in sales.
Sales recovered slightly.
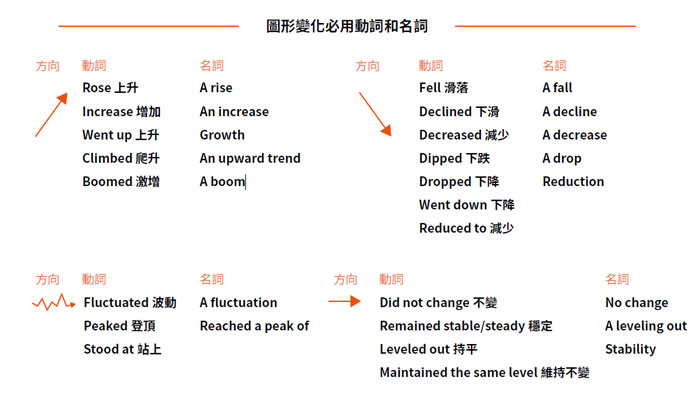
再來,交替使用不同的動詞與名詞。上升或增加,動詞有時用rise,有時用go up,有時用increase,激烈的增加用boom,還可以擬人化一點,用climb(爬升)。
The total sales rose in the first few weeks of the year.
The total sales went up in the first few weeks of the year.
The total sales increased in the first few weeks of the year.
總銷售量在今年的前幾週成長。
這張圖顯示,油價於夏末暴漲到高峰。
This graph shows that the price of oil boomed and hit a peak at the end of summer.
→ 把觀眾的注意力引到圖表上,句型應該替換運用,才不會說來說去都是同一句話:
1. I'd like to refer to the first graph...(我想請大家看第一個圖表...)
2. Please take a look at this graph...(請看一下這張圖...)
3. If I could draw your attention to the graph…(可以的話,請注意這張圖...)
4. Looking at the bar chart on…(看看這個長條圖...)
5. This pie chart shows…(這張圓餅圖顯示...)
請特別注意以上五個動詞:refer to、take a look、draw attention to、look at、show。你不必五個動詞都記熟,但起碼要熟三個。
糧價持續爬升,這是由於劇烈的氣候變化。
The price of grain continues to climb, which is due to the abrupt climate change.
「解釋原因」的片語也請交替使用:due to、a consequence of、because of、a result of

| 加入Line好友 |  |

 擔心生理健康,心理卻出問題?